LDgenX

Explore LDgenX

Ask for a quote

G3: Genes|Genomes|Genetics · 2017

A Dense Brown Trout (Salmo trutta) Linkage Map Reveals Recent Chromosomal Rearrangements in the Salmo Genus and the Impact of Selection on Linked Neutral Diversity

Leitwein M, Guinand B, Pouzadoux J, Desmarais E, Berrebi P, Gagnaire PA

A high-density genetic linkage map is built for brown trout and compared with that of Atlantic salmon. It makes it possible to study chromosomal rearrangements and the relations between recombination and diversity, and is a resource for conservation and aquaculture research.

The question
How can the markers of the trout genome be organised, and the evolution of its chromosomes compared with those of salmon?
The approach
Construction of a map from ddRAD markers in two crosses and comparison of conserved chromosomal regions.
What the article brings
The map supports the study of chromosomal organisation and of the links between recombination and genetic diversity.
The limits
A linkage map describes genetic relations between markers; it is not a physical representation of chromosomes.

Figures from the article
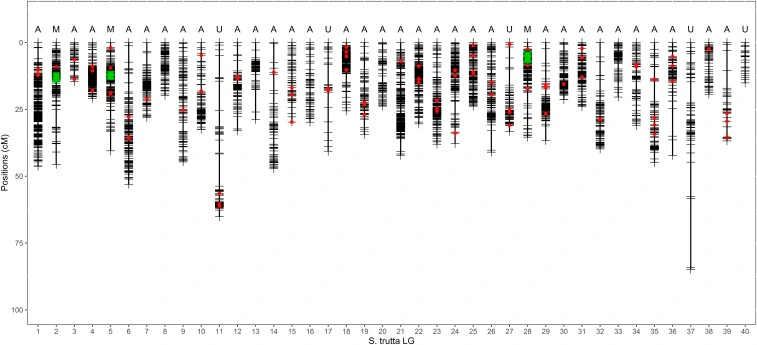
Figure 1, A Dense Brown Trout (Salmo trutta) Linkage Map Reveals Recent Chromosomal Rearrangements in the Salmo Genus and the Impact of Selection on Linked Neutral DiversityFigure (opens in a new tab)
Figure 1. The brown trout(Salmo trutta) high-density linkage map. Horizontal black lines within each of the 40 LGs represent mapped RAD markers(n = 3977). The most probable chromosome type determined with the RFm method(Limborg et al. 2015a) is indicated above each LG. Green boxes indicate the approximate position of the centromere for metacentric LGs. Red dots represent the position of 89 additional markers that were transferred from the previous generation linkage map (see Table S2 for details). A, acrocentric; M, metacentric; U, undetermined.Original caption. Leitwein M et al. (2017), G3: Genes|Genomes|Genetics. CC BY 4.0
Figure 3, A Dense Brown Trout (Salmo trutta) Linkage Map Reveals Recent Chromosomal Rearrangements in the Salmo Genus and the Impact of Selection on Linked Neutral DiversityFigure (opens in a new tab)
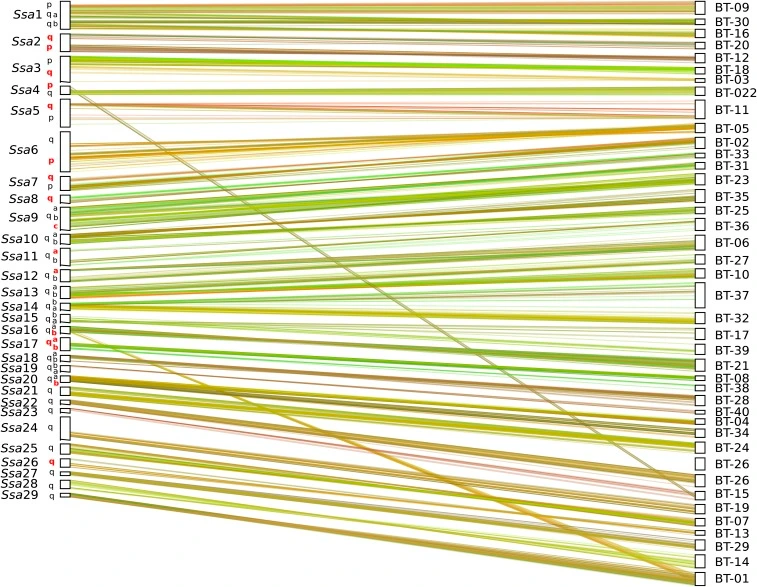
Figure 3. Dual synteny plot showing conserved syntenic blocks and chromosome rearrangements between Salmo salar(Ssa) and Salmo trutta (BT) LGs. Chromosomes arms (p, q a and q b) are specified for S. salar LGs, and the seven pairs of chromosome arms that still exhibit residual tetrasomy in salmon appear in red(Lien et al. 2016).Original caption. Leitwein M et al. (2017), G3: Genes|Genomes|Genetics. CC BY 4.0

Let’s discuss your project

Your question. Our next starting point.

A project in biodiversity, genomics or bioinformatics? Describe your needs to receive a proposal, or book a first conversation with our scientific team.

Or write to us: info@ldgenx.fr