LDgenX

Explore LDgenX

Ask for a quote

Genetics Selection Evolution · 2021

Identification of genomic regions affecting production traits in pigs divergently selected for feed efficiency

Delpuech E, Aliakbari A, Labrune Y, Fève K, Billon Y, Gilbert H, Riquet J

This study looks for genome regions associated with feed efficiency and other production traits in two pig lines divergently selected. The results vary with the line and the structure of the analyses, which underlines the importance of the study design in interpreting associations.

The question
Which genomic regions are associated with production traits, and how do the results vary with the lines analysed?
The approach
Genome-wide association studies on two lines, separately and together, from genotypes and production traits.
What the article brings
Known and new QTL are identified, with limited overlap between some analysis designs.
The limits
Associations depend on the dataset and the analysis design; further analyses are needed to tell traces of selection from genetic drift.

Figures from the article
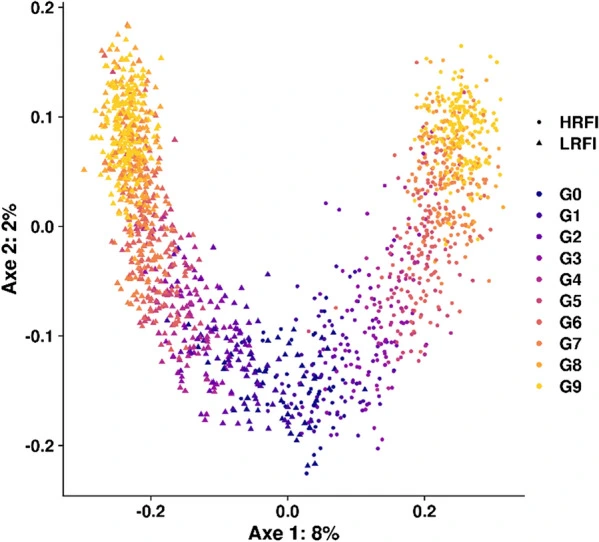
Fig. 1, Identification of genomic regions affecting production traits in pigs divergently selected for feed efficiencyFigure (opens in a new tab)
Fig. 1. The first two axes of the multidimensional scaling (MDS) analysis, based on the 570,447 genotypes. Points represent individuals (corresponding to all sires and dams of the population, N = 1632) and colors are generationsOriginal caption. Delpuech E et al. (2021), Genetics Selection Evolution. CC BY 4.0
Fig. 2, Identification of genomic regions affecting production traits in pigs divergently selected for feed efficiencyFigure (opens in a new tab)
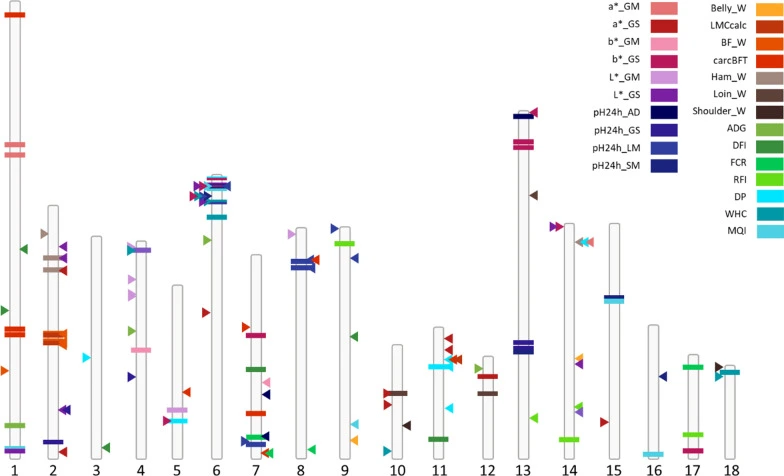
Fig. 2. Location of all SNP-QTL identified on the 18 autosomes from the Global-GWAS, LRFI-GWAS and HRFI-GWAS. The SNP-QTL corresponding to Global-GWAS are represented by horizontal bars, LRFI-GWAS by arrows to the right of the chromosomes and HRFI-GWAS by arrows to the left of the chromosomes. Each color represents one of the 24 traits; LRFI: low RFI line; HRFI: high RFI line; DFI: daily feed intake; ADG: average daily gain; FCR: feed conversion ratio; RFI: residual feed intake; carcBFT: backfat thickness measured on carcass; a_GM: a measured on the gluteus medius muscle; a_GS: a measured on the gluteus superficialis muscle; b_GM: b measured on the gluteus medius muscle; b_GS: b measured on the gluteus superficialis muscle; L_GM: L measured on the gluteus medius muscle; L_GS: L measured on the gluteus superficialis muscle; pH24h_AD: pH 24 h after slaughter measured on the adductor femoris muscle; pH24h_GS: pH 24 h after slaughter measured on the gluteus superficialis muscle; pH24h_LM: pH 24 h after slaughter measured on the longissimus dorsi muscle; pH24h_SM: pH 24 h after slaughter measured on the semimembranosus muscle; WHC: water holding capacity of the gluteus superficialis muscle; MQI: meat quality index; LMCcalc: lean meat content of the carcass; DP: carcass dressing percentage; Belly_W: belly weight; BF_W: backfat weight; Ham_W: ham weight; Loin_W: loin weight; Shoulder_W: shoulder weightOriginal caption. Delpuech E et al. (2021), Genetics Selection Evolution. CC BY 4.0
Fig. 3, Identification of genomic regions affecting production traits in pigs divergently selected for feed efficiencyFigure (opens in a new tab)
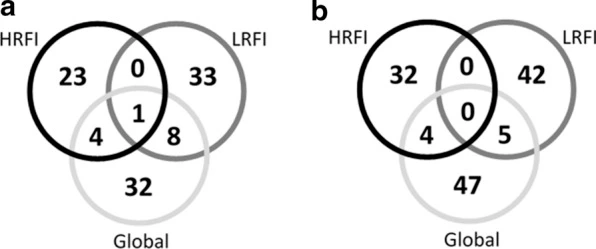
Fig. 3. Comparison of GWAS results obtained from Global-GWAS (Global), HRFI-GWAS (HRFI) and LRFI-GWAS (LRFI). a Comparison of the number of identical regions and b comparison of the number of identical QTL (trait x region)Original caption. Delpuech E et al. (2021), Genetics Selection Evolution. CC BY 4.0

Let’s discuss your project

Your question. Our next starting point.

A project in biodiversity, genomics or bioinformatics? Describe your needs to receive a proposal, or book a first conversation with our scientific team.

Or write to us: info@ldgenx.fr