LDgenX

Explorer LDgenX

Demander un devis

Genetics Selection Evolution · 2023

Whole-genome sequencing identifies interferon-induced protein IFI6/IFI27-like as a strong candidate gene for VNN resistance in European sea bass

Delpuech E, Vandeputte M, Morvezen R, Bestin A, Besson M, Brunier J, Bajek A, Imarazene B, François Y, Bouchez O, Cousin X, Poncet C, Morin T, Bruant JS, Chatain B, Haffray P, Phocas F, Allal F

Chez le bar européen, cette étude recherche les régions génomiques associées à la résistance à la nécrose nerveuse virale. Elle identifie une région partagée entre deux populations et des gènes candidats, dont IFI6/IFI27-like. Les résultats ouvrent des perspectives pour la sélection, sans constituer un traitement contre la maladie.

La question
Quelles régions et quels gènes sont associés à la résistance à la VNN chez le bar européen ?
L’approche
Séquençage génomique, génotypage et imputation, cartographie de QTL dans deux populations et validation de l’effet d’une région dans une population indépendante.
Ce que l’article apporte
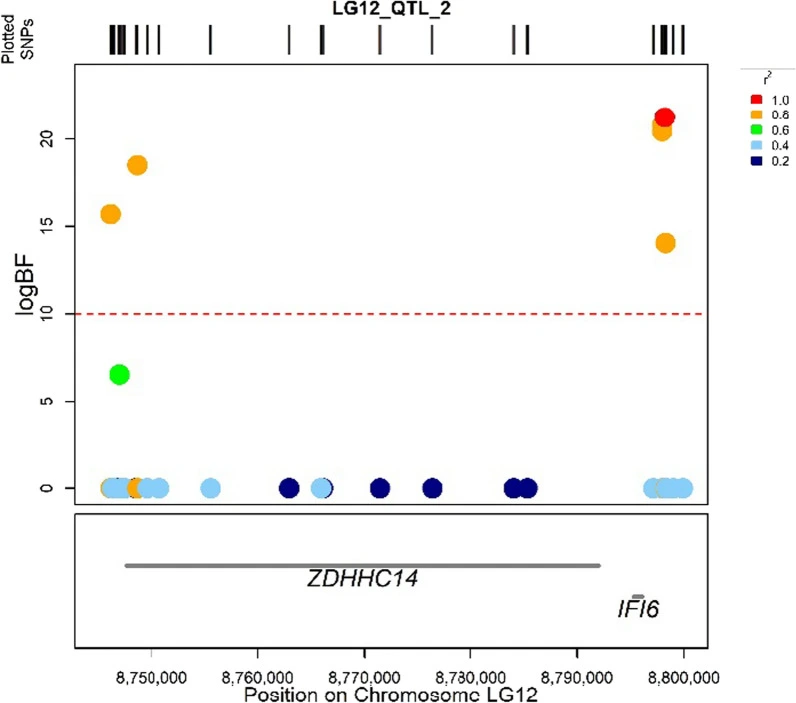
Une région sur le groupe de liaison 12 est associée à la résistance et contient notamment ZDHHC14 et IFI6/IFI27-like.
Les limites
Un QTL associé et un gène candidat ne démontrent pas à eux seuls le mécanisme biologique et ne promettent pas une résistance absolue.

Figures de l’article
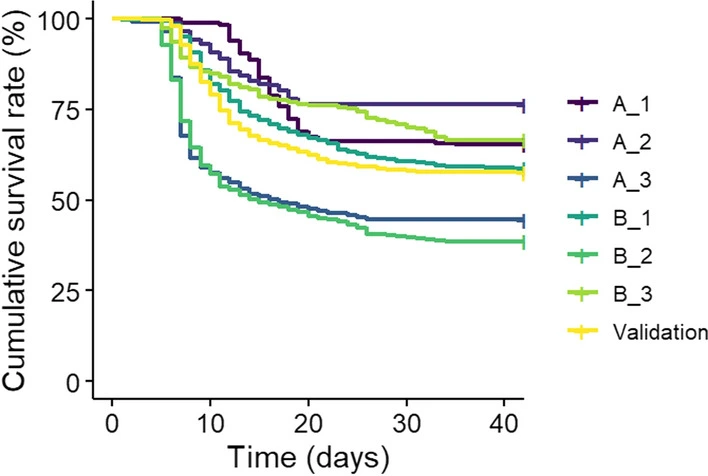
Fig. 1, Whole-genome sequencing identifies interferon-induced protein IFI6/IFI27-like as a strong candidate gene for VNN resistance in European sea bassFigure (nouvel onglet)
Fig. 1. Evolution of the Kaplan–Meier cumulative survival to a VNN infection challenge for each cohort from two commercial populations and a validation population. Results are in purple for pop A (A_1, A_2, A_3), in green for pop B (B_1, B_2, B_3), and in yellow for the validation populationLégende originale (en anglais). Delpuech E et al. (2023), Genetics Selection Evolution. CC BY 4.0
Fig. 2, Whole-genome sequencing identifies interferon-induced protein IFI6/IFI27-like as a strong candidate gene for VNN resistance in European sea bassFigure (nouvel onglet)
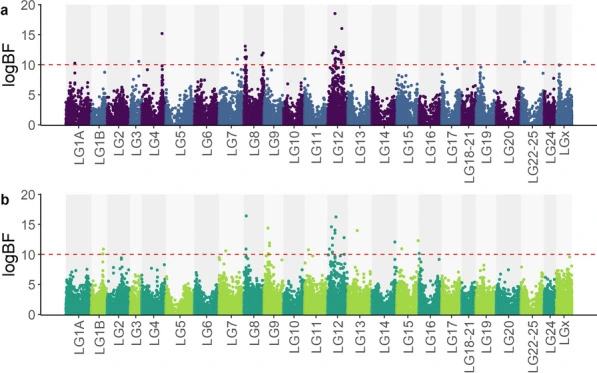
Fig. 2. Manhattan plots of for VNN resistance in European sea bass populations A(a) and B(b). The red dashed line represents the logBF threshold of 10, corresponding to strong evidence for the presence of a QTLLégende originale (en anglais). Delpuech E et al. (2023), Genetics Selection Evolution. CC BY 4.0
Fig. 4, Whole-genome sequencing identifies interferon-induced protein IFI6/IFI27-like as a strong candidate gene for VNN resistance in European sea bassFigure (nouvel onglet)
Fig. 4. Results for the LG12_QTL_2 region showing the SNPs with their genomic positions and the identified genes. The graph displays the logBF value on the y-axis and the physical position on the x-axis. Each point represents a variant in the QTL region, colored according to their LD (based on the squared coefficient of correlation, r 2 measure) with the characteristic variant of this QTL (red point). The red dashed lines indicate the logBF = 10 thresholdLégende originale (en anglais). Delpuech E et al. (2023), Genetics Selection Evolution. CC BY 4.0

Parlons de votre projet

Votre question. Notre prochain point de départ.

Un projet en biodiversité, génomique ou bioinformatique ? Décrivez votre besoin pour recevoir une proposition, ou réservez un premier échange avec notre équipe scientifique.

Ou écrivez-nous : info@ldgenx.fr